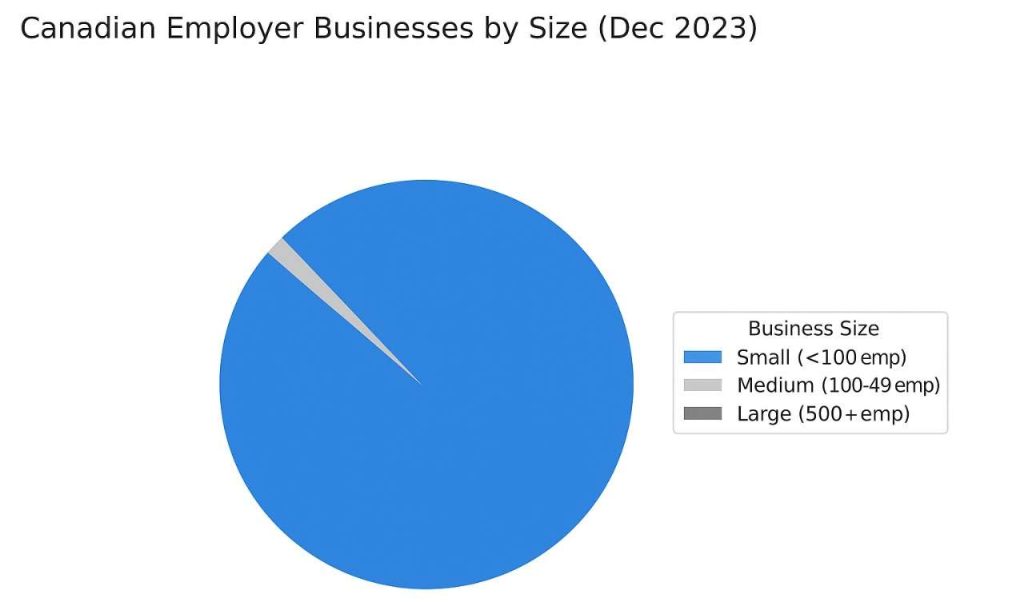
For practical purposes, most Canadian companies generating under $10 million in annual revenue (the ceiling for programs such as the Canada Small Business Financing Program) fall into Statistics Canada’s ‘small‑business’ bracket of fewer than 100 employees.
Understanding the size and economic weight of this cohort helps owners gauge buyer demand, valuation benchmarks and competition when the time comes to sell.
Snapshot of the <$10 M Landscape:
| Metric | Value |
|---|---|
| Total employer businesses (Dec 2023) | 1.10 million |
| Small businesses (<100 employees) | 1.07 million (98.1%) |
| Estimated # of businesses with revenue <$10 M | ≈1 million (est.) |
| Employment supported by small businesses (2023) | 5.8 million jobs (46.5%) |
| Small-business share of private-sector GDP (avg 2017–2021) | 34.7% |
What the Numbers Mean for Owners Planning an Exit
- Sheer volume of peers – with over a million potential <$10 M transactions in play, buyers can afford to be selective. Differentiate early by tightening your financial and documenting processes.
- Labour‑force leverage – small businesses employ nearly half of Canada’s private‑sector workforce. Stable, skilled teams are a valuation driver; reduce owner dependency to stand out.
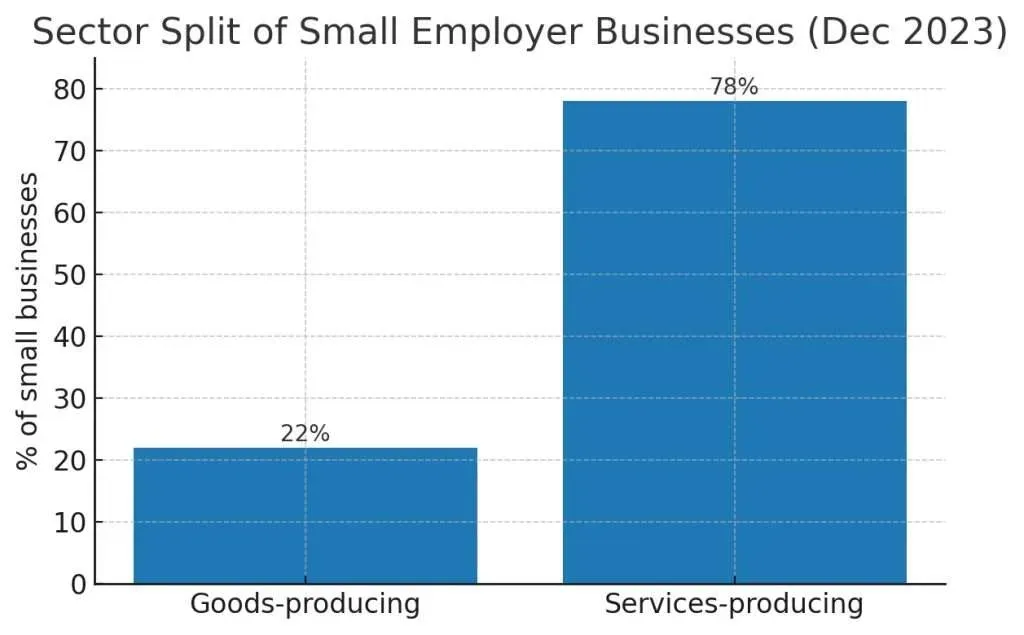
- Sector concentration – four out of five small firms operate in services; manufacturing represents a leaner pool but commands higher multiples due to reshoring trends. Highlight niche expertise and contractual revenue to attract strategic buyers.
- GDP contribution equals bargaining power – at roughly 35 % of private‑sector GDP, small businesses are indispensable. Quality companies with transparent governance routinely see offers in the 3‑4× earnings range.
Next Steps:
Use these data points to benchmark your own position and to start an informed dialogue with advisors. Preparing a formal exit plan 12–36 months ahead typically yields the best outcomes in a crowded market.